
Your Complete Guide: Dynamic Fibonacci Indicator
For many traders Dynamic Fibonacci is still very new and often misunderstood.
In this article I hope to provide a clear understanding of how to use Dynamic Fibonacci and the benefits to viewing them on multiple time frames.
If you have been trading for any length of time I’m almost certain you’ve heard of Fibonacci Retracements as they are probably the most widely used tool in Forex Trading.
Fibonacci has became a self fulfilling prophecy simply because it is so widely used by traders on many different time frames. Fib Levels are used by long term traders looking at the daily charts as well as savvy short term traders looking to trade smaller cycles in the market.
The Problem With Fibonacci Retracements
Like anything in trading, I find that when there is discretion involved in ones strategy, unless they have years of experience, it can stir up emotion which can create all kinds of problems like hesitation, over trading, revenge trading etc…
Which leads me to the primary problem with Fibonacci Retracements. Drawing accurate retracement levels on a chart are still very discretionary for the majority of traders.
If I were to ask 20 traders from different trading backgrounds to draw retracement levels, I’m sure I would get 20 different results as to which levels each of the traders would trade off of.
Some people draw from the absolute high to low, others draw from strong levels (candle closes), while some traders take into account subjective time frame data. There is no one size fits all method for drawing accurate retracement levels.
How Dynamic Fibonacci Solves Discretion
Often times if you take Fibonacci Retracements and draw them over the top of the FxPM Dynamic Fibonacci Charts the levels will overlap.
The difference with Dynamic Fibonacci, is that it’s using a standardized formula to calculate where to plot the levels. By doing this we are able to filter out the “noise” and calculate the Fibonacci Levels more accurately.
Another advantage to Dynamic Fibonacci is that it automatically calculates extension levels for a market that has moved past it’s 100% retracement level.
Watch The Video Explanation Below
As you can see from the video walk-through of the Dynamic Fibonacci Indicator, it is very responsive to the levels.
Of course they will not respect each level with 100% accuracy all of the time, but with some screen time and familiarizing yourself with price action you can put the odds greatly in your favor.
The video above was only showing one time frame, with only those levels you could have generated several profitable trading opportunities.
Here’s a screenshot of the levels being respected.
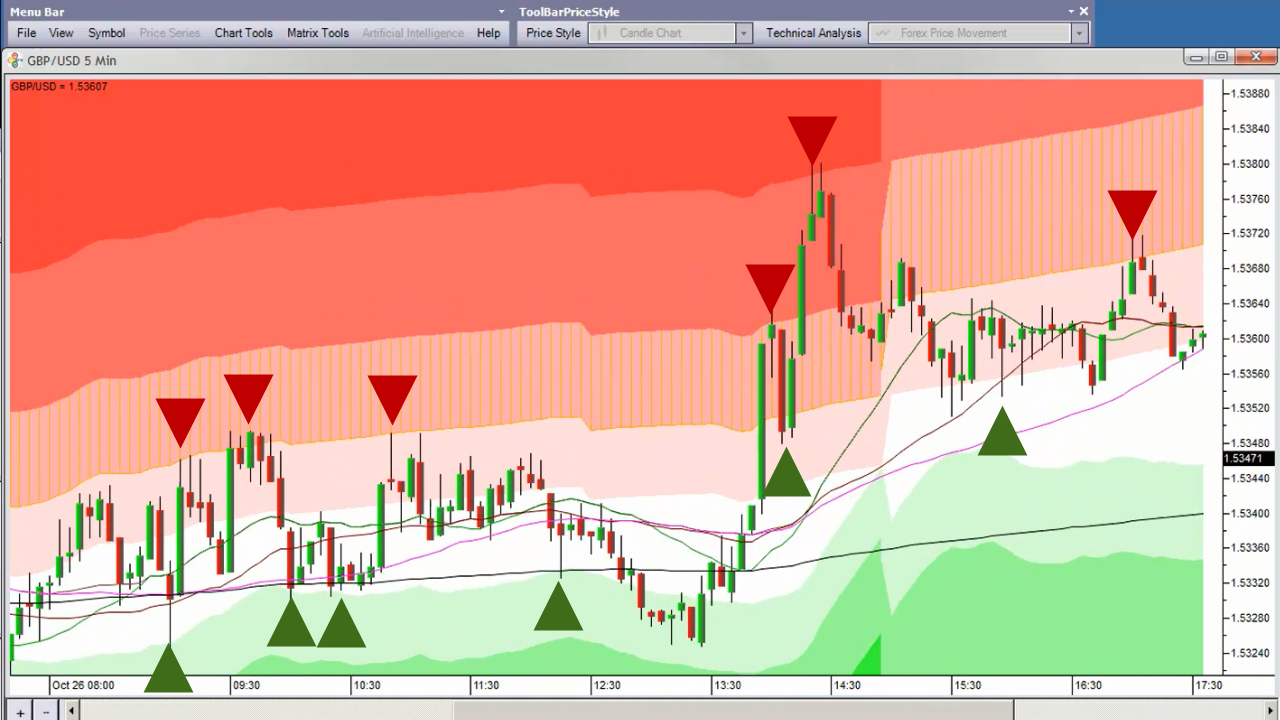
In this example we are only looking at a 5 minute chart which also happens to be one of my favorite to watch given that I’m a very short term trader.
However the FxPM Software is doing the calculations on all the time frames and plotting that information in the matrix.
With the Forex Matrix you see Dynamic Fibonacci levels across the 1, 5, 15, 60, and 240 minute chart. Allowing you to get the big picture view of the market as well as the precise entry points on the smaller time frames.
You can also apply Dynamic Fibonacci to longer time frames such as the daily charts and weekly charts for you long term traders out there.
You can see exactly how the Multi Time Frame Matrix works in the video below.
After watching both of the videos above I’m hopeful that you can see how the FxPM Software helps you spot high probability setups across multiple time frames.
The best way to spot trade entries is to look for confluence across multiple time frames.
This will increase your probability of the trade being respected because traders of different methodologies and time frames will be looking at those levels as well.
 One of the favorite strategies of our software users is to identify 2+ Fibonacci Columns that are within the green and red zones and trade off of those levels with a very tight stop loss back to the center zone of the matrix.
For our more active traders they will use the Dynamic Fibonacci Indicator in the center zone (white middle area). This can provide many trading signals however your probability can diminish because price action is likely absent.
See Example Below
If your new to the FxPM software, the video above explains the basic concept of trading passive zones.
While there are 6 tested strategies with FxPM understanding the Dynamic Fibonacci Indicator is key to using FxPM to generate consistent trading results.
I hope this article serves as your complete guide to understanding Dynamic Fibonacci and how to use it. If you still have questions please post them in the comments and I am happy to answer!

Matt Miller
Sr. Trader
For over 9 years I have been trading Forex and working closely with Armando Martinez, the Founder and creator of The FxPM Software to develop FxPM. It is our goal to develop a Forex Software that not only simplifies trading decisions but also delivers institutional performance to the retail trader.

Hello Mr Matt !
My doubt is what’ s mean the colored arrows and how to use? Thanks.
You can learn more about the arrows in this post – https://fxpmsoftware.com/fxpm-software/best-forex-trend-indicator/